Towards fair Energy use: Setting a global per capita Power limit

Case for a 3200W global per capita power limit.

Since the Industrial Revolution, the steady rise in global temperatures has closely mirrored the surge in industrial emissions, largely driven by the combustion of fossil fuels. To truly grasp our dependence on fossil fuels, its impact on climate change and its role in the energy transition, it helps to shift focus from emissions alone to the underlying driver: rate of energy use, or power consumption.
By analyzing per capita power consumption across societies, I aim to uncover historical trends, highlight the limits of modern consumption, and show why reducing power demand among the affluent is crucial for a fair and sustainable energy transition in the current era. We will also explore how power consumption or wattage, as a metric, offers a simpler and more intuitive lens than emissions tracking, helping us clarify global energy priorities.
Pre-industrial era
Power consumption in the Hunter-Gatherer Era was limited to the metabolic energy derived from food, which ranged between 80 and 100W. Our activities were once confined to basic survival. As we transitioned to agrarian societies, we began harnessing the power of cattle (~400W) and horses (~746W), which expanded our range of activities and, in effect, increased our wattage by an order of magnitude.
When we figuratively say someone is a "workhorse," we usually mean they handle the workload of two or three people. But quantitatively, it’s closer to eight people’s workload (746W/100W). That makes it an even higher praise than we realise!
Industrial era
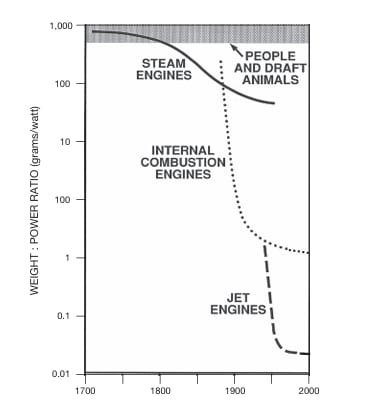
With the advent of coal burning to generate steam and engines that converted it into mechanical power, our wattage capacity jumped by three to four orders of magnitude. This breakthrough marked the beginning of the industrial era, which grew even more power-intensive with the later use of gasoline and natural gas in internal combustion engines and modern gas turbines.
This exponential rise in unit power delivered by industrial machines is illustrated in Figures 1 and 2 below (note: the y-axis in both graphs is on a logarithmic scale).
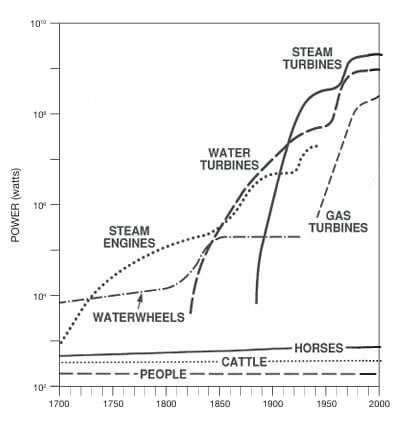
The boost from fossil fuel energy, combined with the invention of the Haber-Bosch process to produce fertilizers and scale up agricultural production, enabled humanity to feed large populations and achieve unprecedented prosperity. (The Haber-Bosch process is a method of making ammonia by combining nitrogen from the air with hydrogen gas.)
Our per capita wattage increased from about 400W in the pre-industrial era to a global average of roughly 2,500W currently. However, in developed economies, this figure is between 6,000 and 10,000W, supporting a higher material standard of living.
Parallelly, the modern per-capita wattage in western economies is facing pushback from nature through the symptomatic climate change, caused by the side effects of burning fossil fuels rapidly within a century. So how do we move forward?
We have two choices: 1. develop cleaner energy sources which can deliver the same per-capita wattage, or 2. reduce our per capita energy consumption to a level which brings climate change under some reasonable level of control (try to stay within 2 °C of warming). While the first option is desirable, the second option is uncomfortable for most people. As you’ll see next, the evidence overwhelmingly favors the second option.
Energy transition constraints
Replacing fossil fuels with renewables like wind and solar or nuclear or batteries is not a straightforward replacement, as seen from the qualitative analysis of multiple parameters in the table below.
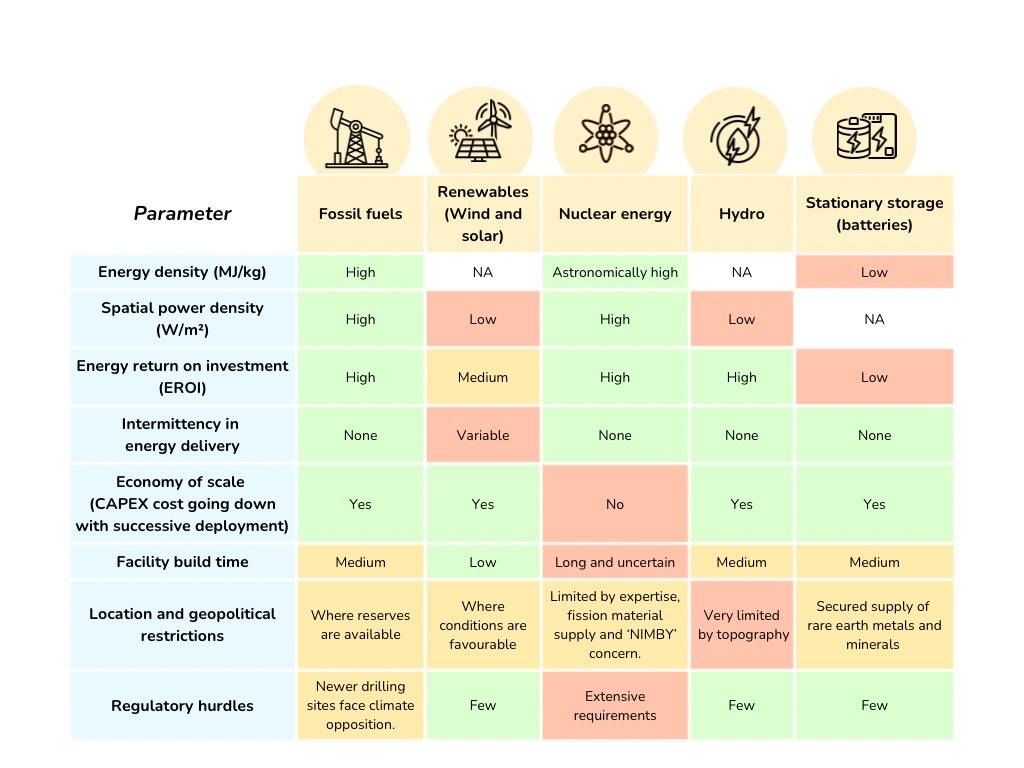
We are currently heavily reliant on fossil fuels and will continue to do so as it does not have a 'red box' against it, unlike its alternatives. Secondly, the first five parameters in the table are crucial for our energy security, and fossil fuels meet all of them, unlike their alternatives, which is why they remain the dominant energy source.
Energy density and intermittency in energy delivery is widely understood; hence we will focus on the Spatial power density parameter from the table in this article while we have already covered the EROI parameter in detail in my earliest article and its implications on the energy policies for India in a follow up article. Spatial power density refers to the power delivered by an energy source divided by the land area required to produce it (see Appendix for values across energy sources).
Howard Odum's Maximum Power Principle (MPP), which states, “During self-organization, system designs develop and prevail that maximize power intake, energy transformation, and those uses that reinforce production and efficiency,” is highly relevant here. Put simply, MPP suggests that organisms able to capture and use more energy in an ecosystem gain a selective advantage.
Since the Industrial Revolution, humans have followed this path, tapping concentrated fossil fuels to extract even more energy and expand use cases such as computers, space exploration, AI and unfortunately on wars. Today, however, we are at a crucial juncture where climate change forces us to question whether continuing this fossil-fuel-driven path of MPP is sustainable.
Unfortunately, renewables like wind and solar cannot carry us further on this path of maximizing power output, as shown by their low spatial power density. Figure 3 illustrates how renewables fall significantly short of matching the power density needed to sustain our current fossil-fuel-driven lifestyle.
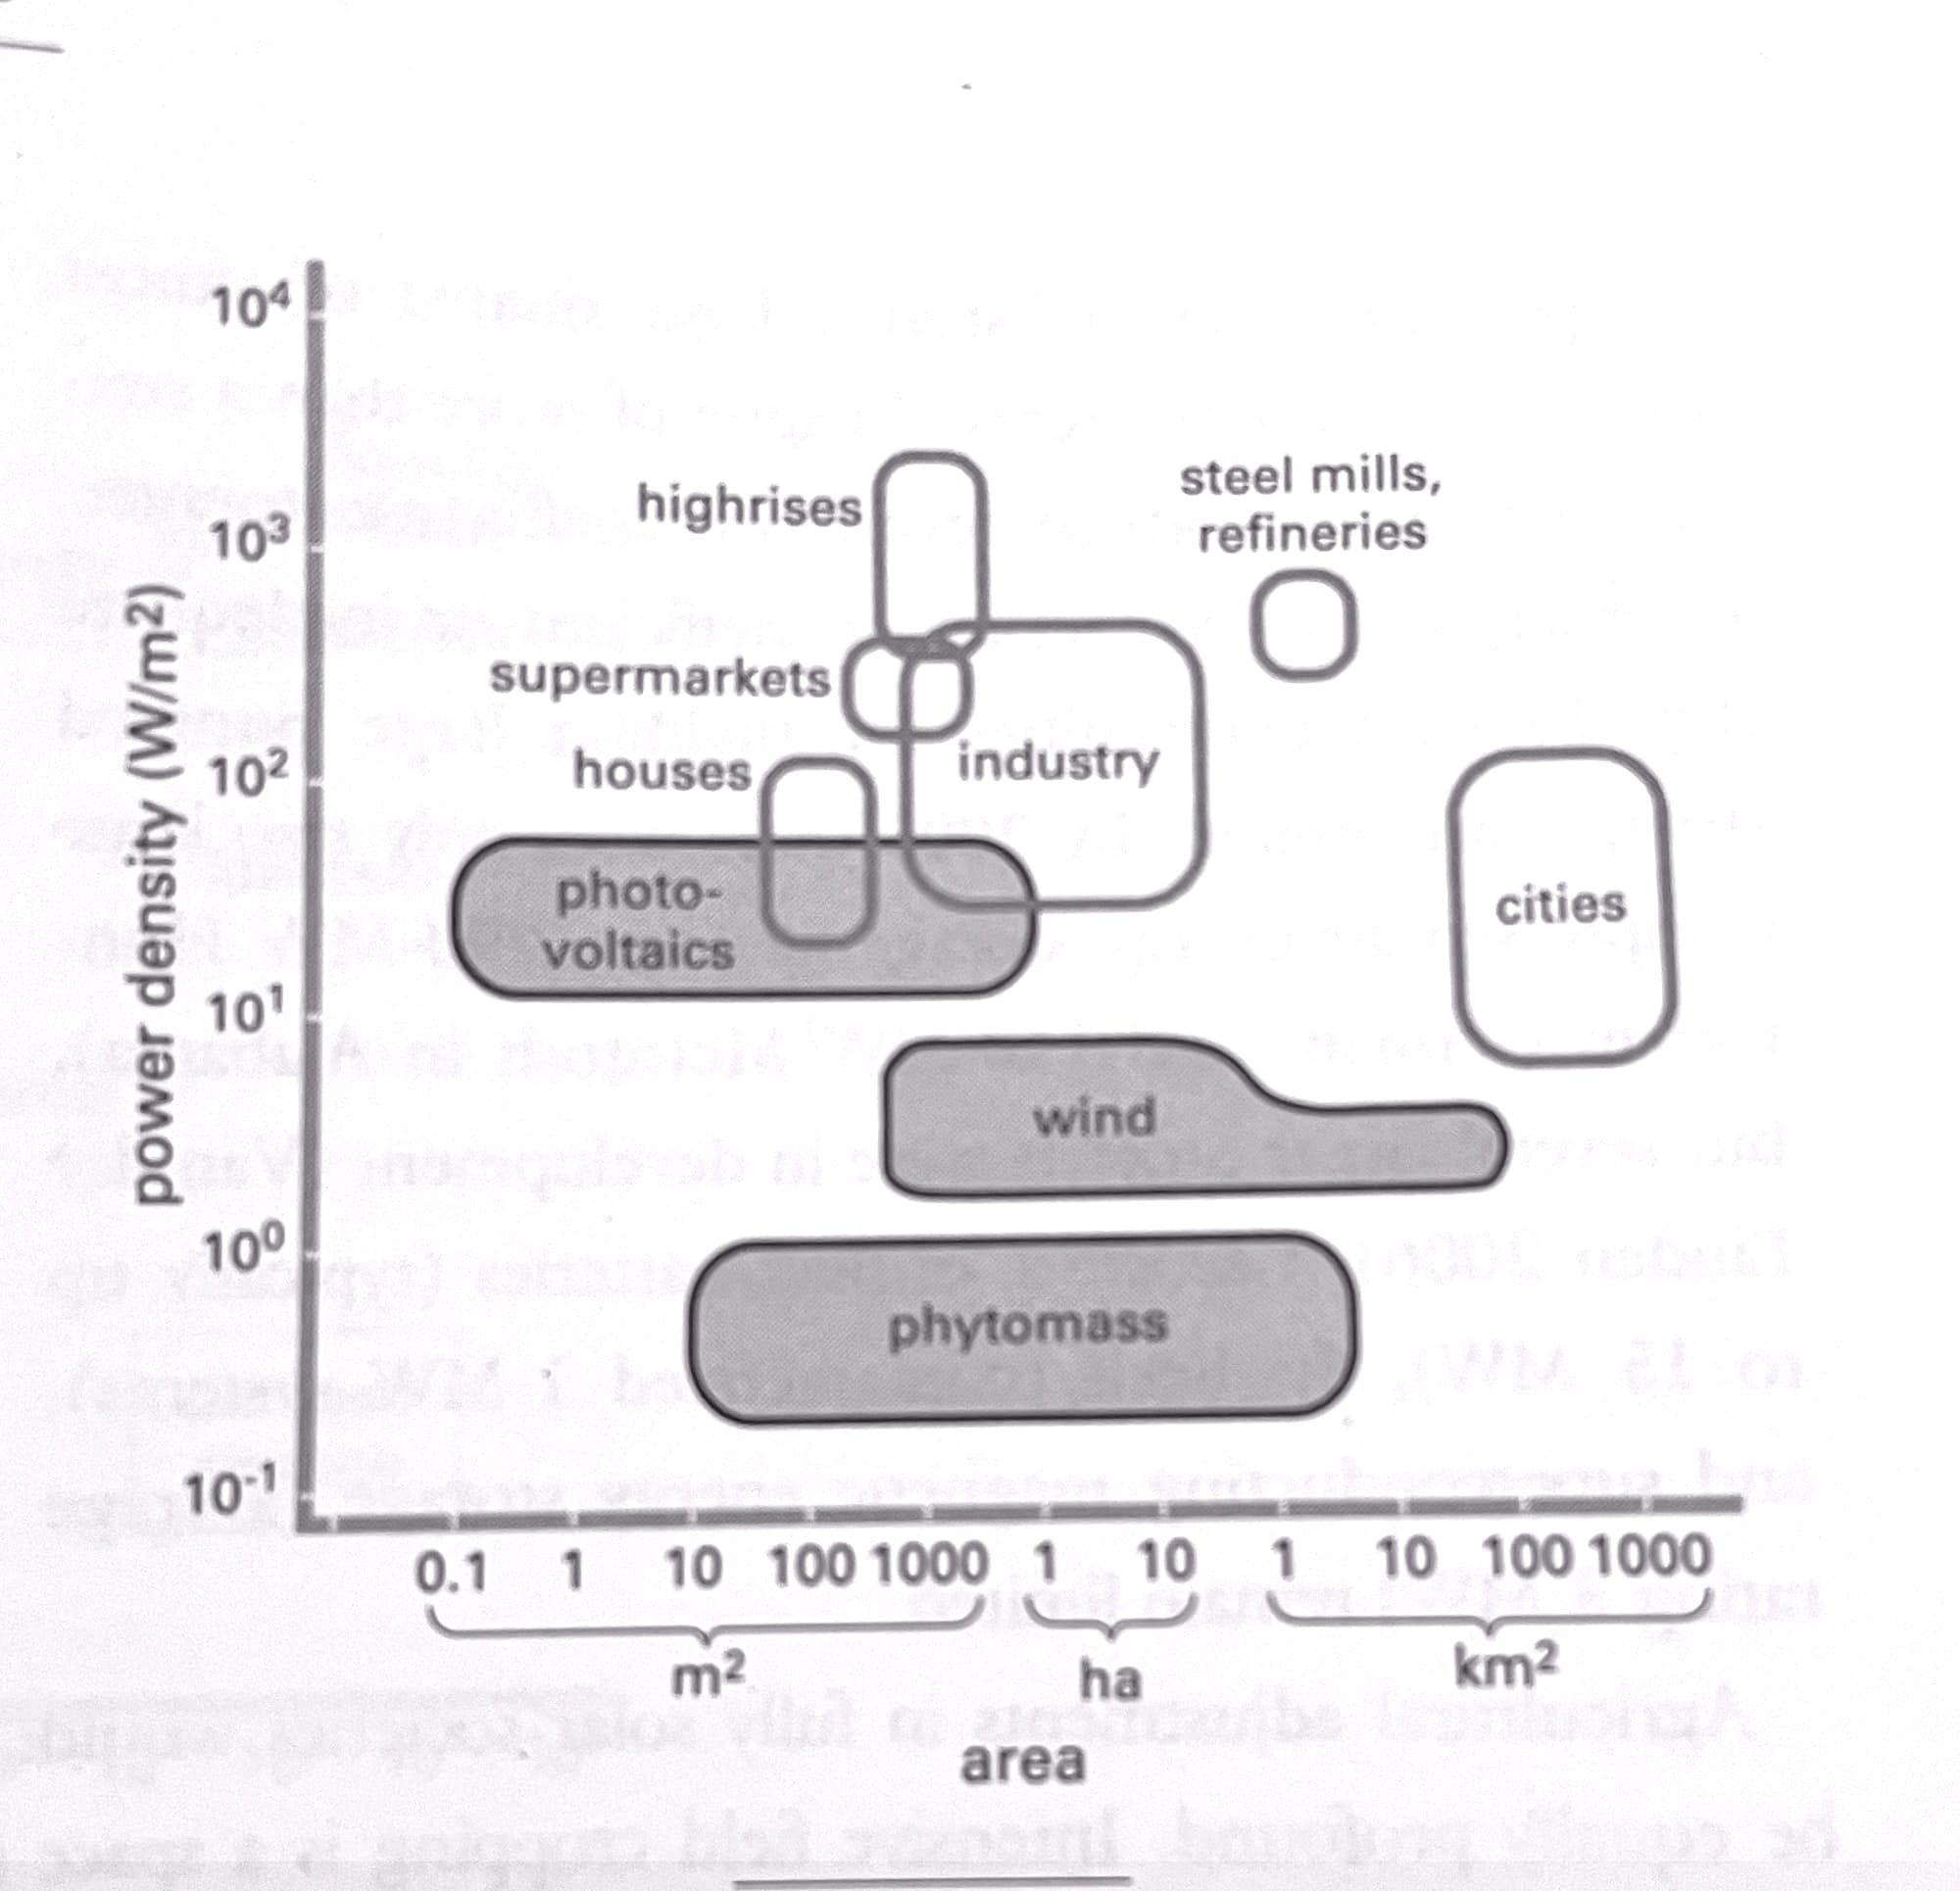
All the unfilled rectangles on the chart, which represent the energy sources sustaining our modern lifestyle, are powered by fossil fuels. The solid rectangles, representing renewables, clearly fall one or two orders of magnitude lower in spatial power density. This means that powering modern societies with renewables alone would require significant reductions in per capita wattage, or lifestyle energy use.
Only Nuclear energy is better than fossil fuels in their spatial power density as seen in the visual above, but it faces persistent challenges: difficulty for nuclear fission to achieve unit cost parity with renewables due to limited economies of scale, uranium ore quality decline and nuclear waste disposal while nuclear fusion still far away from commercial deployment. Despite these challenges, there are global efforts on the nuclear path of MPP— significant funding in nuclear fusion development and continued enrichment of Uranium for nuclear fission power. The nuclear path of MPP is more eco-friendly than fossil fuel path of MPP but our current burgeoning energy demand doesn't give us the time to make the complete switch from fossil fuels to nuclear.
Hence, we will continue to use other energy sources to complement the fossil fuels in the global energy mix and not substitute them unless we reduce our per capita wattage. To phase out fossil fuels, moving to renewables is necessary but not sufficient until we voluntarily agree to reduce our per capita energy consumption.
It is also important to remember that we will eventually descend on the Hubbert's curve, meaning the phase-out of fossil fuels will be inevitable if not done voluntarily. From an ethical perspective, transitioning to renewables sooner is preferable, as it allows us to preserve some fossil fuel reserves for future generations.
Another reason to reduce per capita wattage, especially in the developed countries, is the saturation of the human development index (HDI) after a certain threshold of per capita primary energy consumption, as seen in the graph below.
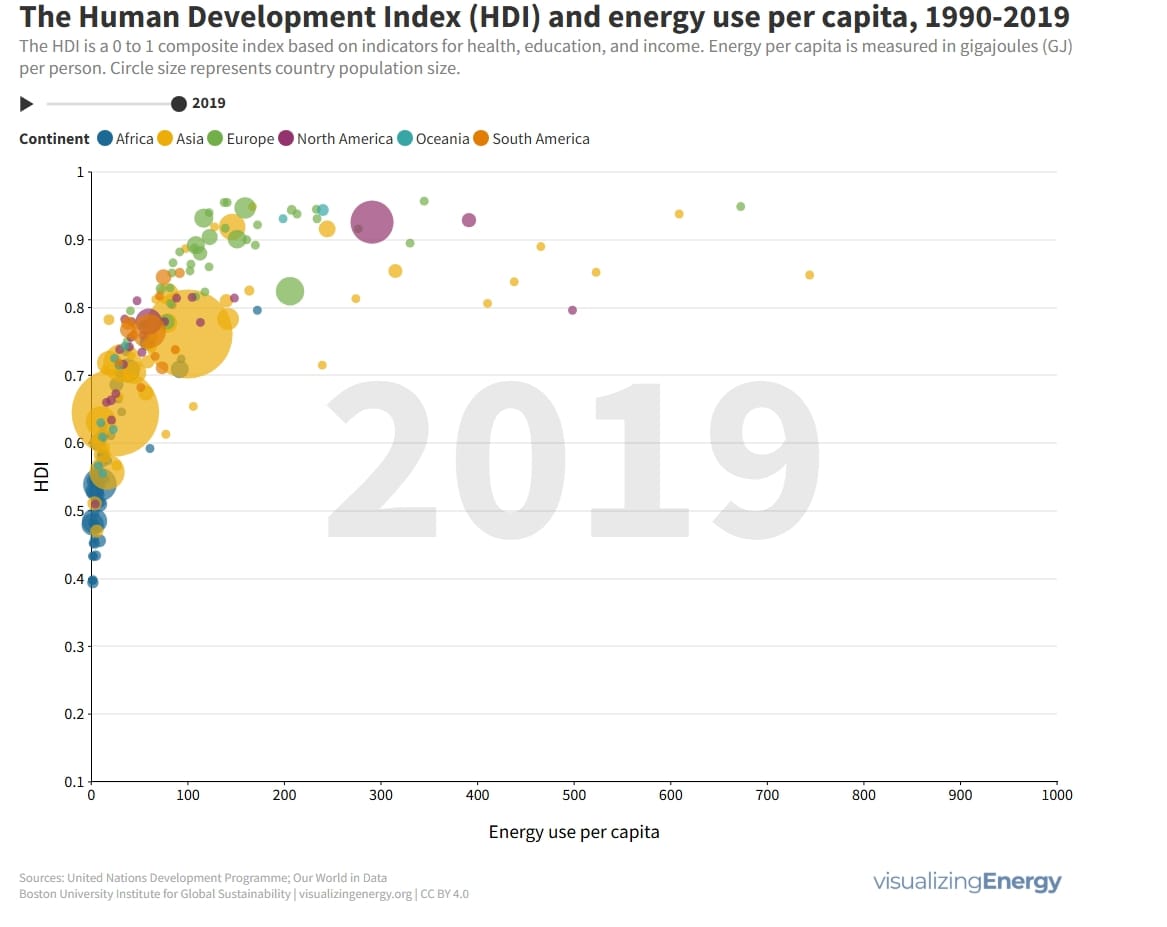
The HDI curve flattens beyond a primary energy threshold of approximately 100 GJ per capita per year, which corresponds to around 3,200 Watts (or 28,000 kWh). Past this point, gains in HDI are marginal, and additional per capita energy use can be considered excessive. Notably, the 3,200-Watt threshold is sufficient to support all modern human comforts, but not luxuries such as frequent long-haul air travel, large personal vehicles (particularly gasoline or diesel SUVs), oversized and energy-inefficient homes, daily consumption of red meat, high-consumption lifestyles (such as fast fashion or constant gadget upgrades), or energy-intensive leisure activities like private jets, superyachts, and crypto mining.
On the topic of global threshold for per capita power consumption, energy researchers like Peter Strack have advocated for 2000W societies in the western countries which gives a comfortable material standard of living to the people living in these countries while leaving the carbon budget for developing countries to catch up to this level.
A per capita limit of 3200W is a ‘reasonable threshold’ for developed countries and for the upper middle-class in developing countries to achieve multiple goals: slightly reducing the standard of living for the affluent, enabling a transition to lower power-density renewables, and simultaneously redistributing excess energy and carbon budgets so developing countries can reach this wattage level.
The only group affected by this threshold is the ultra-rich or high-net-worth individuals (HNWI) who drive global wealth and energy inequality in the first place. Currently there are just over 16 million people around the world in the HNWI demographic (net worth over 1 million USD excluding primary residence), who need to moderate their energy consumption. Therefore, wealth redistribution through progressive taxation, offshore wealth penalties, and philanthropy become crucial for global energy equity and a successful transition to lower power-density renewables.
Tracking Wattage over emissions
Emission monitoring has become so dominant in climate change action plans that it often comes at the expense of tracking per capita power consumption. Let’s explore the value of focusing on the latter.
By tracking energy or wattage, you are closer to the source of human activity than by tracking emissions. Energy consumption can be directly metered, whereas emissions disperse into the atmosphere and must be estimated unless CO₂ sensors are present at the point of activity. This makes wattage tracking inherently simpler and more accurate. Emissions accounting is further complicated by the need to account for multiple greenhouse gases for each industrial activity and by the requirement for activity emission factors. Even though open-access emission factors are available through platforms like Climatiq or other LCA databases, calculations still face challenges such as leakage, attribution ambiguity, and inconsistent accounting boundaries.
It is also useful for a layperson to know their personal power consumption, as it allows them to contextualize energy sector developments. For instance, when reading about new power added to the grid via solar, wind, or storage, one can estimate the scale of the installation (in megawatts or gigawatts) by multiplying their per capita consumption by their region’s population.
Furthermore, a layperson can gain a better appreciation and intuition for energy consumption than for emissions from their personal activities, especially when considering orders-of-magnitude energy jumps introduced by new technologies. For example, the development of artificial intelligence (AI) relies on high-compute semiconductor chips. Some of the latest chips have individual power requirement – known as thermal design power (TDP) – approaching 1000W and expected to go to 6000W in the near future. A layperson, knowing only their per capita power consumption of 2,500W, can intuitively grasp that AI is highly energy-intensive when considering data centers with racks full of such chips. This kind of intuition is not immediately apparent from emissions tracking. Knowledge of power consumption is more empowering than emissions for the average person.
Tracking wattage also gives the concept of sustainability more clarity, leaving no room for corporates to greenwash or misrepresent it. Currently, the entire emissions consulting industry is structured to support corporate reporting obligations, and their net-zero target setting and helping countries on compliance with UN Nationally Determined Contributions (NDCs) for their emissions. The corporate sustainability and ESG landscape focus narrowly on emissions while overlooking the bigger issue: there can be no clean energy transition without reducing the wattage of modern economies.
Tracking wattage provides clearer insight into global energy access and is better suited for setting targets, such as global wattage rationing through the UN, than the complex and convoluted NDC emission targets under the Paris Agreement.
With the rise of AI and automation, corporate and national emissions tracking will get increasingly automated, further diminishing the need for many humans to work on emissions consulting. In contrast, knowledge of per capita and aggregate power consumption remains essential. Emission accounting will still be important though for carbon sequestration projects related to forest cover, soil or ocean. Outside nature-based carbon removal projects, wattage accounting trumps over carbon accounting.
Conclusion
The Spatial power density parameter exposes the illusion that renewables can fully replace fossil fuels in modern societies, while the global per capita power threshold of 3200W allows developed and developing countries to ‘meet in the middle,’ promoting global energy equity and effective climate adaptation.
Choosing to deviate from the fossil-fuel-driven path of MPP emphasizes cooperation over competition and frames energy equity not as a zero-sum game while fostering long-term prosperity and cultural diversity worldwide. Ultimately, it is up to us to consciously diverge from the fossil-fuel-driven path of MPP to achieve a more egalitarian global order.
We would really appreciate your monetary support if you enjoyed reading this post and found it insightful.
PS: This article has been edited by Anjaly Raj.
Appendix
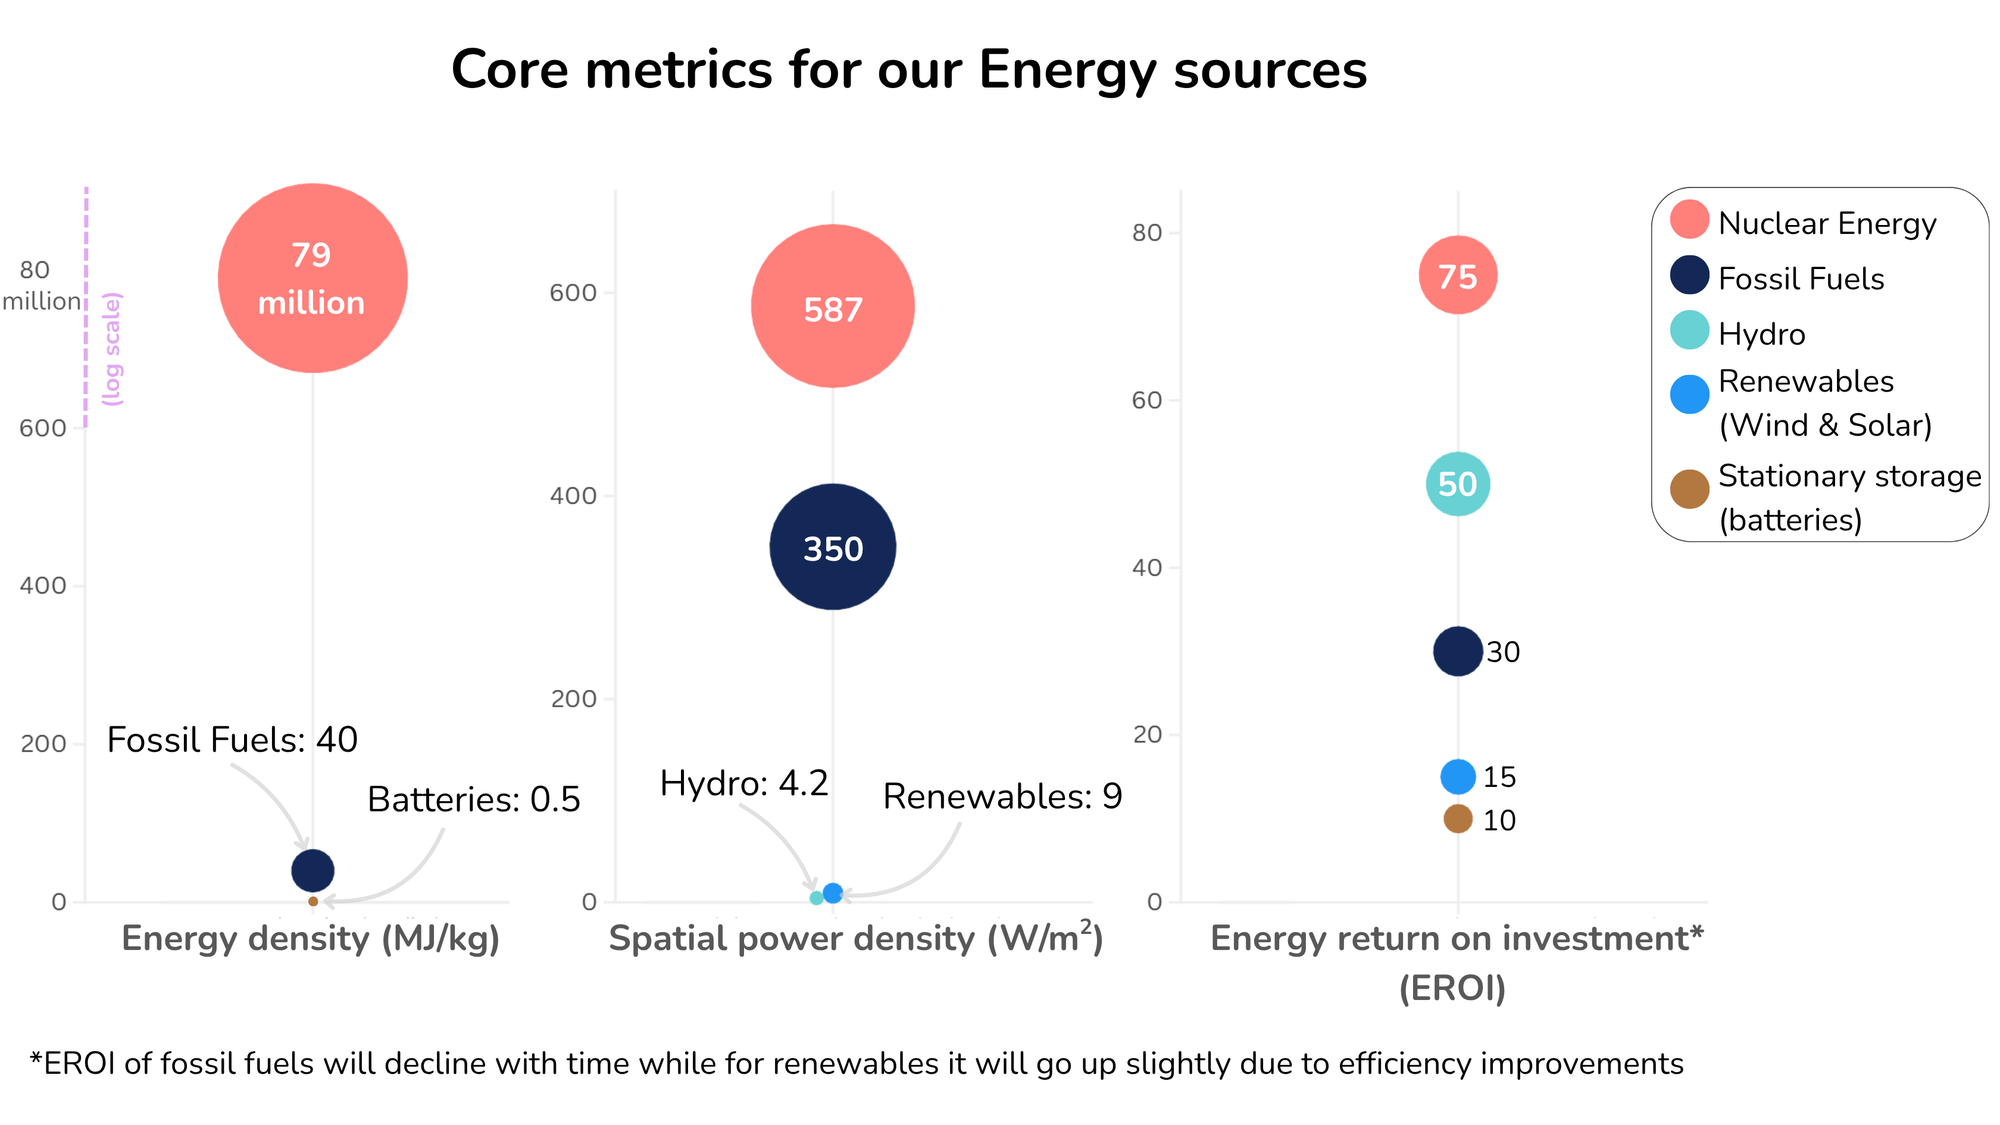
The values of the three primary energy metrics used in Figure 4 is shown below. Note, with time, energy density and spatial power density will remain the same for energy sources but EROI of fossil fuels will decline with time due to farther offshore drilling, making it energy intensive. EROI for renewables and batteries will go up slightly with time from efficiency improvements.
| Parameter | Fossil fuels | Renewables (Wind and solar) |
Nuclear energy | Hydro | Stationary storage (batteries) |
|---|---|---|---|---|---|
| Energy density (MJ/kg) |
40 | NA | 79*10^6 | NA | 0.5 |
| Spatial power density (W/m²) |
350 | 9 | 587 | 4.2 | NA |
| Energy return on investment (EROI) |
30 | 15 | 75 | 50 | 10 |
Below is the Spatial power density data of the output electricity from various energy sources. Accounting for electric energy conversion efficiency and transport of the fuel to the production site (Reference paper for the data).
| Energy source | Average Spatial power density (W/m2) |
| Nuclear fission (including safety area) | 587 |
| Natural gas | 350 |
| Hydro | 4.2 |
| Solar (CSP) | 14.4 |
| Solar PV | 9.1 |
| Wave | 9.7 |
| Geothermal | 5.5 |
| Solar rooftop | 4.1 |
| Wind offshore | 3.8 |
| Tidal | 2.3 |
| Wind onshore | 1.5 |
| Biomass | 0.08 |
For waste-to-energy (WTE) plants, spatial power density varies based on factors like technology, fuel type, quality of the waste (calorific value) and plant design. but typically, they have a relatively high spatial power density compared to renewable energy sources like wind or solar. One such WTE plant in outskirts of Bengaluru has spatial power density of 18 W/m2 (11.5MW capacity over 160 acres site).

This work is licensed under CC BY-SA 4.0![]()
![]()
![]()